

Blog
How to Measure the Color of Water
Water color is measured either via standardized lab tests using the Platinum-Cobalt (Pt-Co/APHA) scale and spectrophotometry for regulatory compliance, or through continuous digital sensing (RGB,





Water color is measured either via standardized lab tests using the Platinum-Cobalt (Pt-Co/APHA) scale and spectrophotometry for regulatory compliance, or through continuous digital sensing (RGB, CIE, LUX) for real-time trend monitoring and event detection.
Water color looks like the simplest parameter in the water quality toolkit. Anyone can glance into a tank, a reservoir, or a sample jar and say the water looks yellow, brown, or green. The problem is that “looks” isn’t a measurement, and the moment you need a number you can log, compare, or defend to a regulator, water color turns out to be one of the more misunderstood parameters in water testing.
That’s partly because “measuring color” means two different things depending on who’s asking. A municipal lab running a compliance test wants a single, standardized number on a recognized scale. A hydroponic grower or aquaculture operator watching a reservoir 24/7 wants a continuous stream of data that flags a change the moment it happens. Both are legitimate ways to measure water color, each with the right tool behind it.
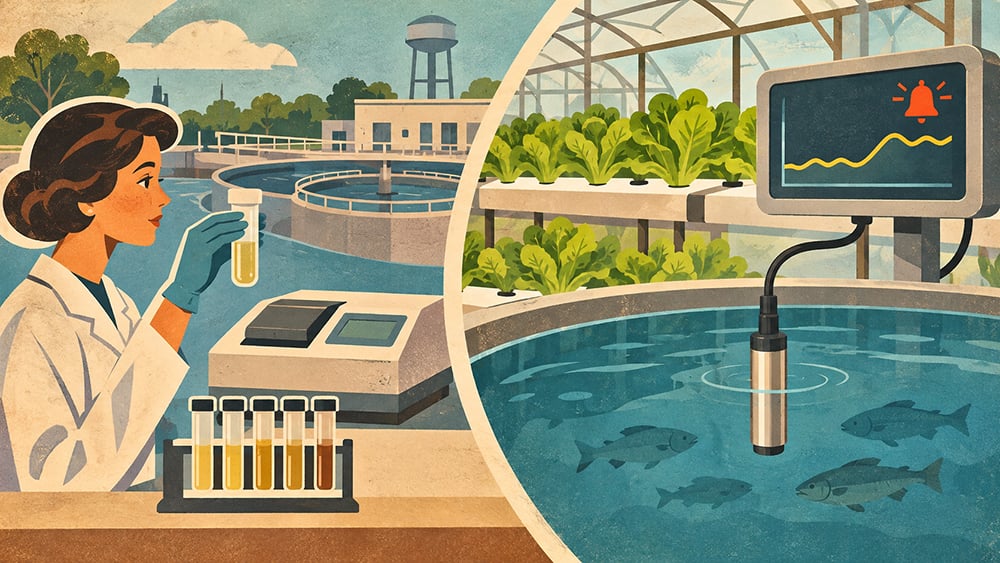
This guide breaks down how each approach works, how they differ, and how to choose the right method and hardware for your application.
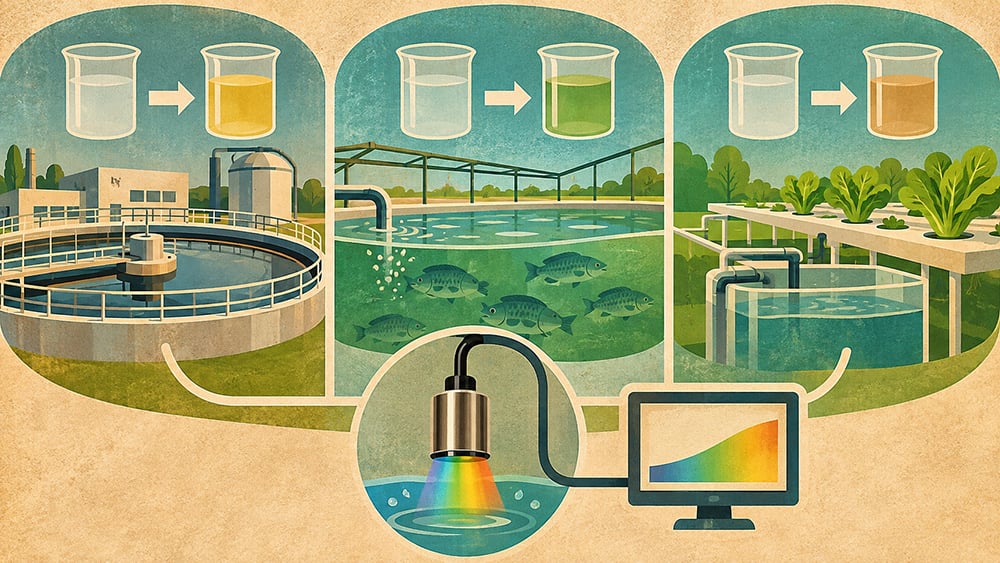
Color shift is rarely the problem itself; it’s the early warning sign of something else going on. Dissolved organic matter, tannins from decaying vegetation, algae blooms, iron and manganese oxidation, industrial discharge, and process contamination all change the color of water before they show up in other readings.
In a treatment plant, a shift toward yellow can signal increasing natural organic matter, relevant to disinfection byproduct formation. In an aquaculture system, a green shift usually means an algae bloom is underway. In a hydroponic reservoir, an unexpected color change can be the first visible clue of nutrient breakdown before pH or EC readings move, which makes color a leading indicator rather than a lagging one, provided it’s actually measured, not just eyeballed.
Before choosing a method, it’s worth understanding a distinction that trips up a lot of first-time testers: apparent color and true color are not the same measurement.
Apparent color is what you get from a raw, unfiltered sample. It includes color from suspended particles, turbidity, and anything else floating in the water, not just dissolved compounds.
True color is measured after the sample has been filtered to remove suspended solids, isolating the color that comes specifically from dissolved substances like tannins, humic acids, and dissolved metals.
The two numbers can differ significantly on the same sample. A cloudy pond might read high on apparent color largely because of suspended sediment, while its true color, the dissolved fraction, could be comparatively low. Reporting apparent color when a spec calls for true color, or vice versa, is one of the most common water color testing mistakes, and it’s worth confirming which one your application actually requires before you run a single test.
The long-standing benchmark for water color is the Platinum-Cobalt scale, also called Pt-Co, Hazen, or APHA color, first developed in the 1890s to evaluate the purity of public water supplies. It’s still the reference method behind ASTM D1209 and the APHA Standard Methods for the Examination of Water and Wastewater, and it remains the scale most drinking water, wastewater, and process water specs are written against.
The scale runs from 0 (distilled, colorless water) to 500 (distinctly yellow), based on comparison against dilutions of a platinum-cobalt reference solution. Traditionally, this was done visually, comparing a sample against reference standards by eye. Today it’s usually done with a spectrophotometer reading absorbance at roughly 455-465 nm, which removes the subjectivity of visual comparison.
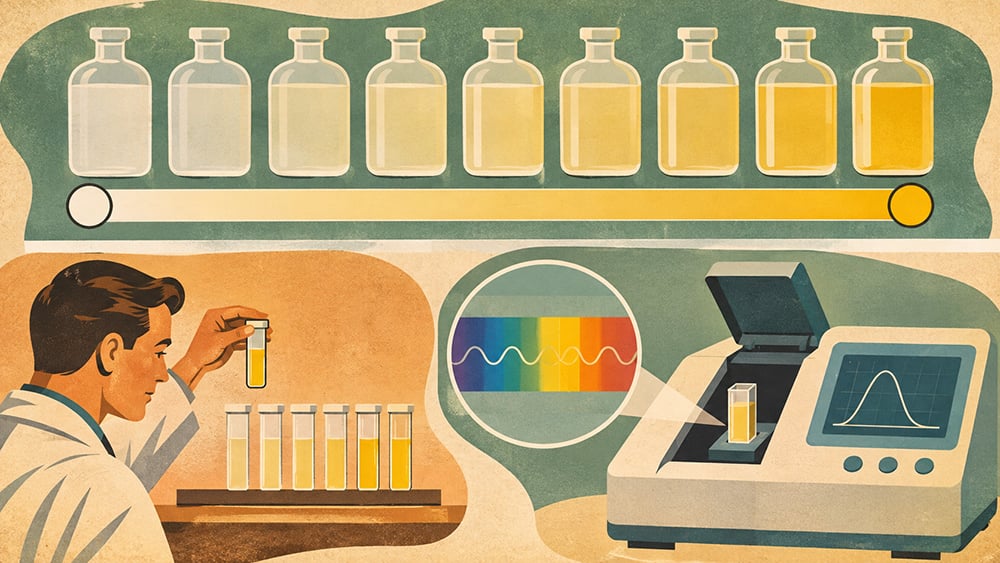
This method is accurate, standardized, and widely accepted, but it’s built around a grab sample. Someone has to collect the water, filter it if true color is required, run it through an instrument, and log the result. It’s the right tool for a defensible, regulation-grade number at a point in time, the wrong tool when what you need is to know the instant something changes.
For continuous or embedded monitoring, the more practical approach is an inline color sensor that reads color as digital data, all day, without a technician present. This is where a device like the Atlas Scientific EZO-RGB™ Embedded Color Sensor fits in.
Rather than outputting a single Pt-Co number, the Atlas Scientific EZO-RGB™ Embedded Color Sensor measures color in 24-bit RGB, CIE xyY, and LUX (0–65,535). With a response time of 400 milliseconds, it supports frequent color measurements that can be recorded and analyzed by a connected monitoring system. This makes it useful for tracking color changes over time and identifying deviations from established baseline conditions. For how the sensor itself works- output formats, LED calibration, sensitivity- see our guide to color sensor applications.
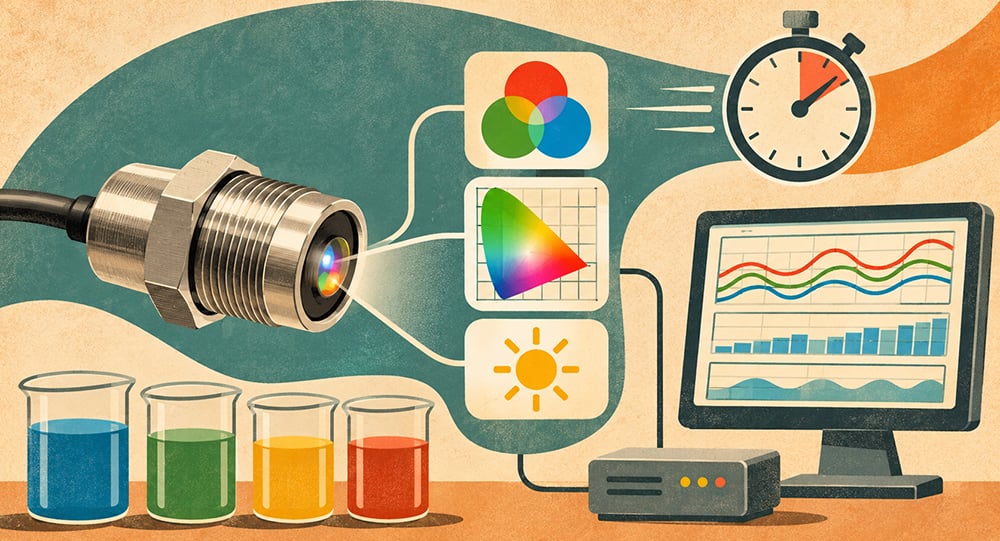
It’s worth being direct about what this approach is, and isn’t. An embedded RGB/CIE sensor doesn’t hand you a regulatory Pt-Co figure out of the box; it gives you objective, repeatable, continuous color data you can trend, alarm on, and correlate against other parameters.
For a compliance report calling for Pt-Co or APHA units, the lab method above is still the method of record. For catching a bloom, a nutrient shift, or a contamination event early, continuous sensing is the more useful tool, and it’s the gap most water color guides skip entirely.
| Situation | Best Approach | Why |
| Regulatory or compliance reporting | Lab Pt-Co / APHA method | It’s the recognized, standardized scale specs are written against |
| Detecting a bloom, contamination event, or process drift early | Continuous inline sensor (EZO-RGB™) | Reads every 400ms instead of waiting for the next grab sample |
| Reservoir, tank, or treatment basin monitoring | Continuous inline sensor | No technician required; data logs automatically over time |
| One-off product or batch verification | Lab Pt-Co / APHA method | Matches a fixed, comparable scale across batches |
| Hydroponic or aquaculture systems tracking trends | Continuous inline sensor | Pairs naturally with pH, DO, and conductivity data already being logged |
Many operations end up using both: a continuous sensor for day-to-day awareness, backed by periodic lab-grade testing to confirm compliance numbers when it matters.
If you’re going the continuous-sensing route, housing matters as much as the sensing element itself; see our breakdown of the stainless steel vs. plastic EZO-RGB™ bodies in color sensor applications for the full comparison.
For more on how body material affects long-term reliability across sensor types generally, see our guide to sensor housing.
Color is the water quality parameter most easily thrown off by a bad setup. Get the mounting or lighting wrong, and the reading isn’t just noisy; it’s meaningless.
Mount the sensor in its permanent position before calibrating; a handheld dunk test won’t match a fixed reading. Set LED brightness to match real operating conditions, then run white-balance calibration from there, and check periodically against a known standard.
A few things specific to water systems: Submerged sensors are prone to slow biofilm and sediment buildup on the sensing window, so a short cleaning schedule matters more here than on a benchtop unit.
The distance between the EZO-RGB™ and its target plays an important role in color measurement accuracy. As the distance increases, the amount of reflected light reaching the sensor decreases, making colors more difficult to distinguish. At distances greater than approximately 45 cm, many colors may appear as varying shades of gray. In water applications, turbidity, bubbles, and light scattering can further affect readings, making a consistent and application-tested optical arrangement especially important.

Color rarely tells the full story alone, which is why it’s most useful alongside other parameters. A color shift alongside a dissolved oxygen drop points toward an algae bloom. A color shift alongside a pH swing points toward contamination. Because the EZO-RGB™ shares the same UART/I2C protocol as the rest of Atlas Scientific’s EZO™ line, it drops into an existing monitoring rig through the same EZO™ Carrier Board without redesigning your wiring.

We’ve also published walkthroughs on connecting a color sensor to an Arduino Uno and connecting a color sensor to a Raspberry Pi for anyone building a custom system.
Water color measurement splits into two genuinely different disciplines: a standardized lab method built for a defensible number at a single point in time, and continuous embedded sensing built to catch change the moment it starts. Neither replaces the other, and knowing which one your application actually needs, and understanding the apparent-versus-true color distinction along the way, is most of the battle.

If you’re weighing up a continuous color monitoring setup for a reservoir, hydroponic system, treatment process, or production line, browse the Atlas Scientific color sensor range, or get in touch with the world-class team at Atlas Scientific. As leaders in water quality sensing, we have the expertise to help you spec the right sensor for your specific application.
Water color is measured either via standardized lab tests using the Platinum-Cobalt (Pt-Co/APHA) scale and spectrophotometry for regulatory compliance, or through continuous digital sensing (RGB,

Color sensors are used to measure and quantify color with a precision the human eye simply cannot match. They play a critical role in water